- Daily installs
- 0
- Total installs
- 64
- Version
- 2024.12.17.1920
- Created
2024-09-18 - Updated
2024-12-17 - Size
- 30.2 KB
- Compatibility
-


- License
- MIT
- Applies to
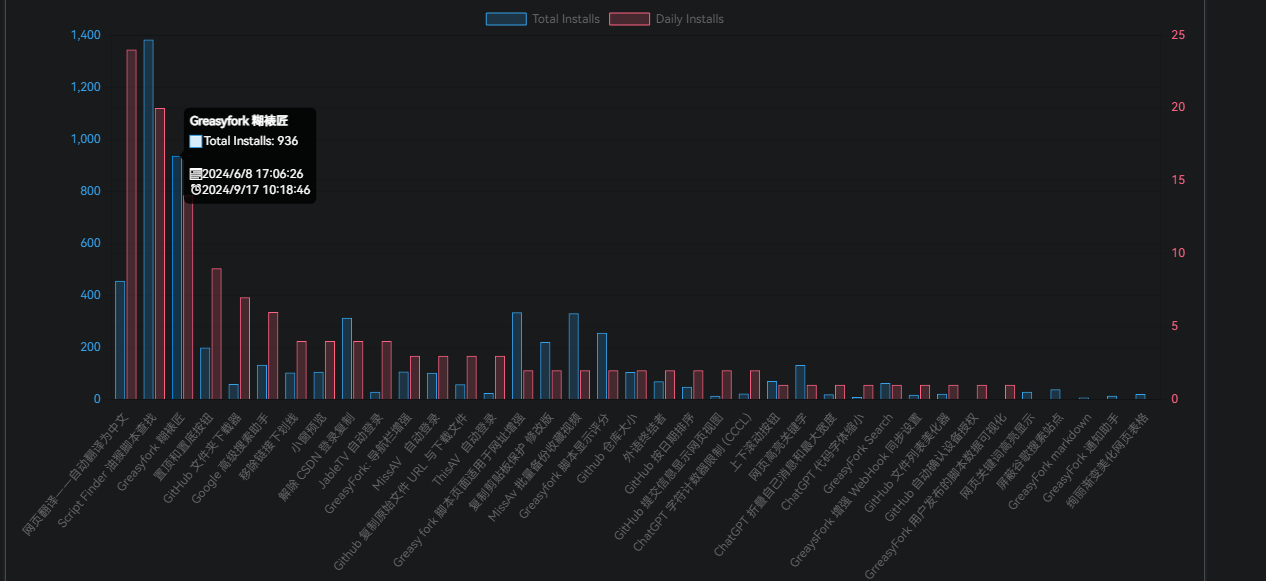
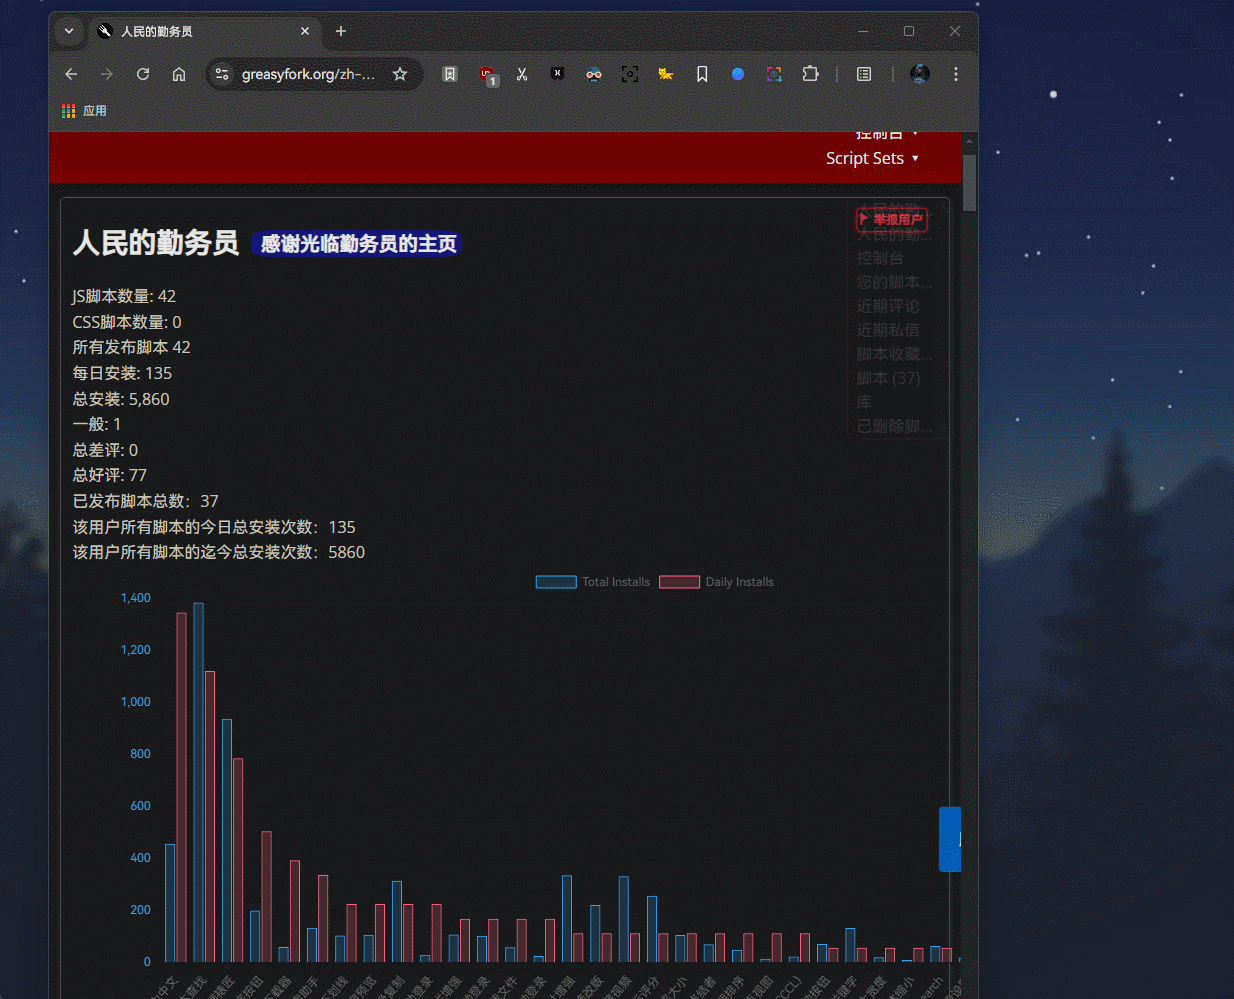
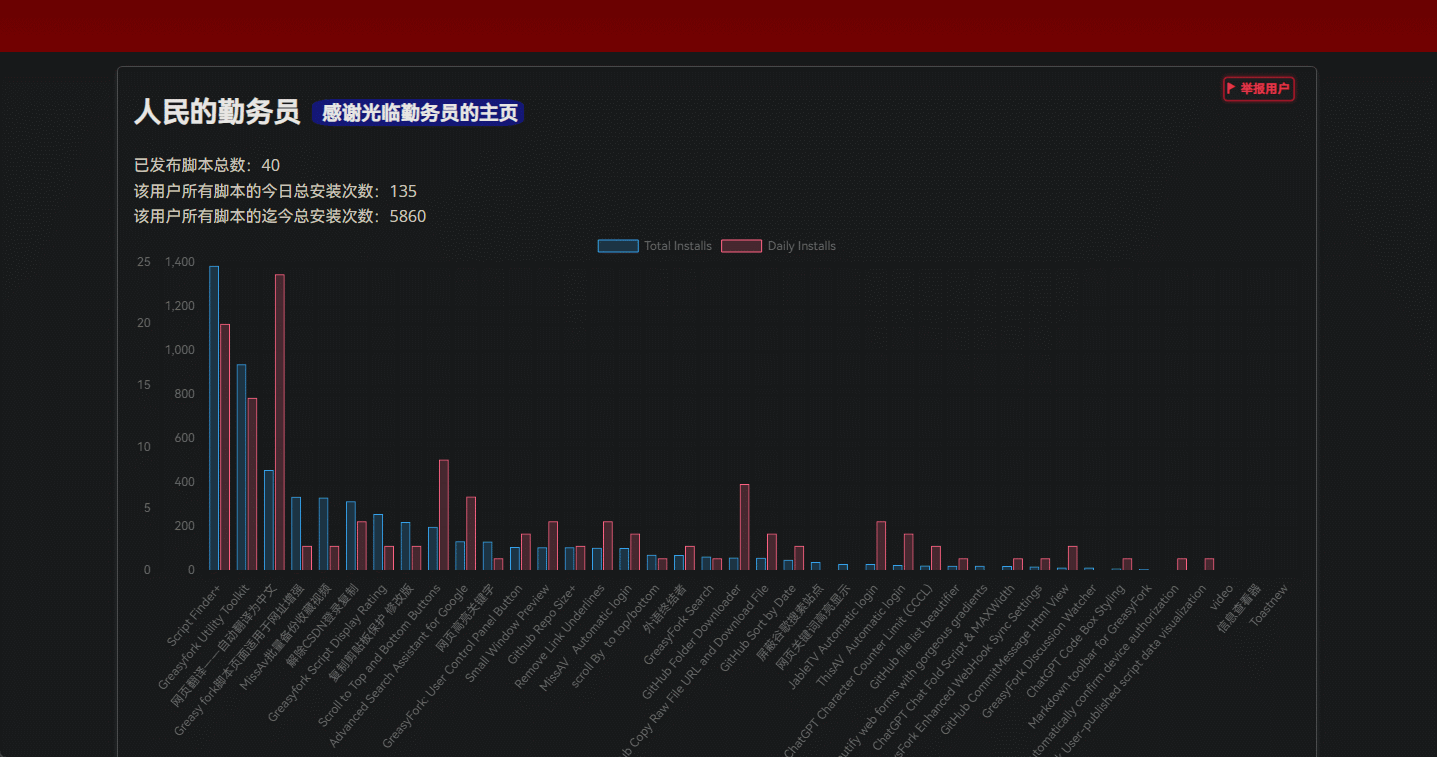
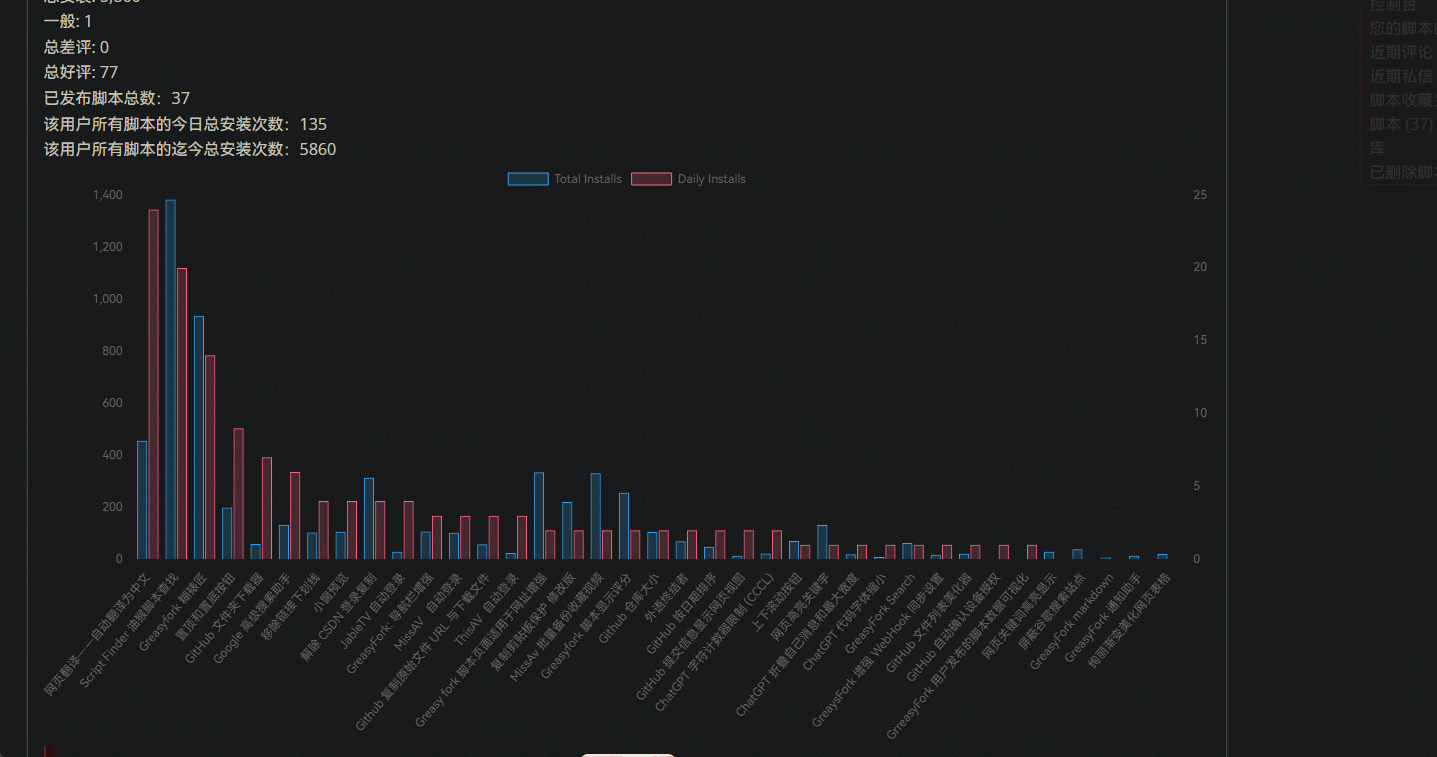
useChart.jsObtaining and visualizing user script data,And generate a chart on the user’s personal homepage to display the detailed installation

「 useChart.jsObtaining and visualizing user script data,And generate a chart on the user’s personal homepage to display the detailed installation status below. 」


Download:Github | ⭐Greasy Fork
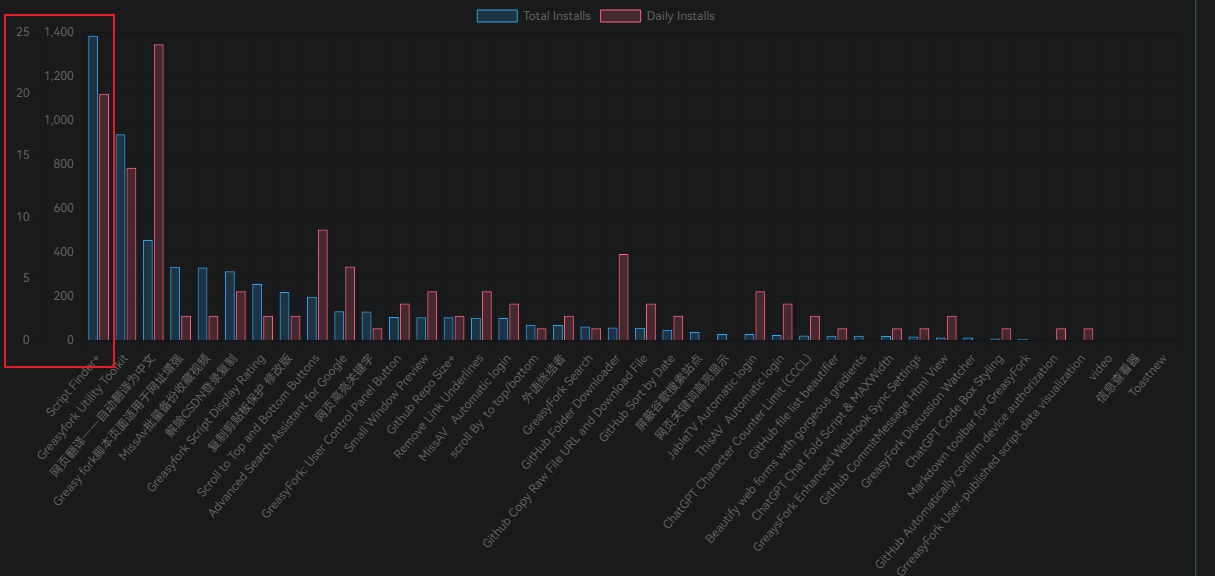
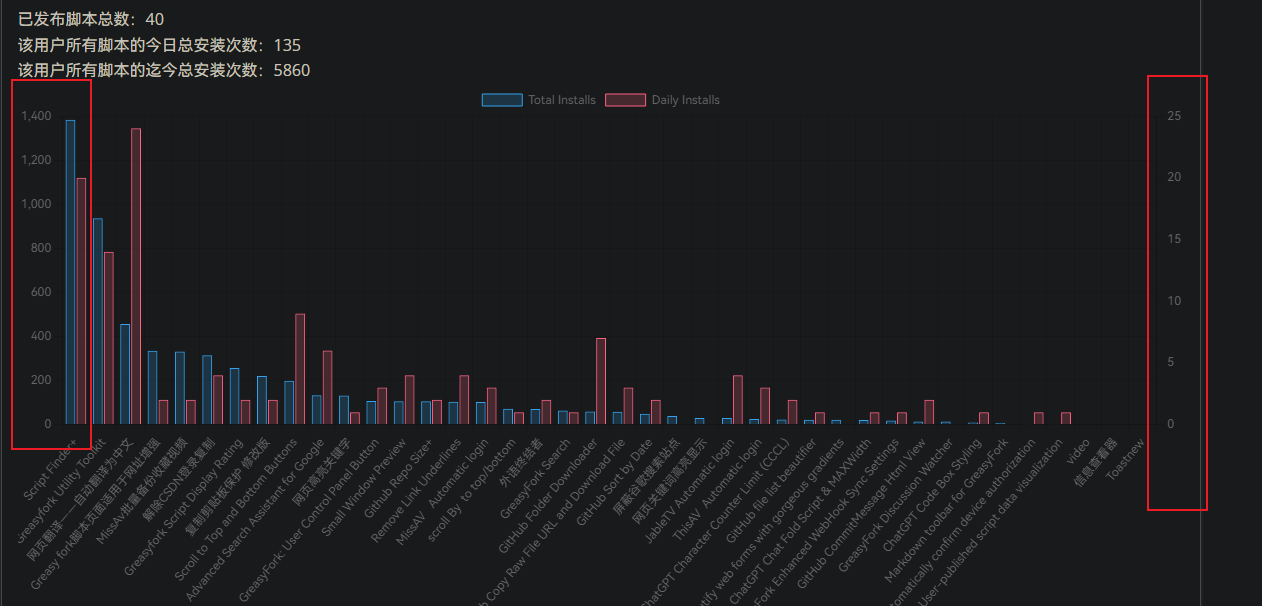
New: •Add some small functions to use.Table displays creation and update dates YThe axis value is highlighted Click the bar chart to jump to the corresponding script In the scriptOPENLINK for0Don’t jump,1There are tips before jumping,2Jump directly
| New | Added a demo |
|---|---|
 |
 |
Revise: •Revisechart.jsFor the first load,Save it after loadinglocalStorageNo need for repeated loading
repair: • Fix some problems with the chart.
| Before modification | After modification |
|---|---|
 |
 |
 |
 |
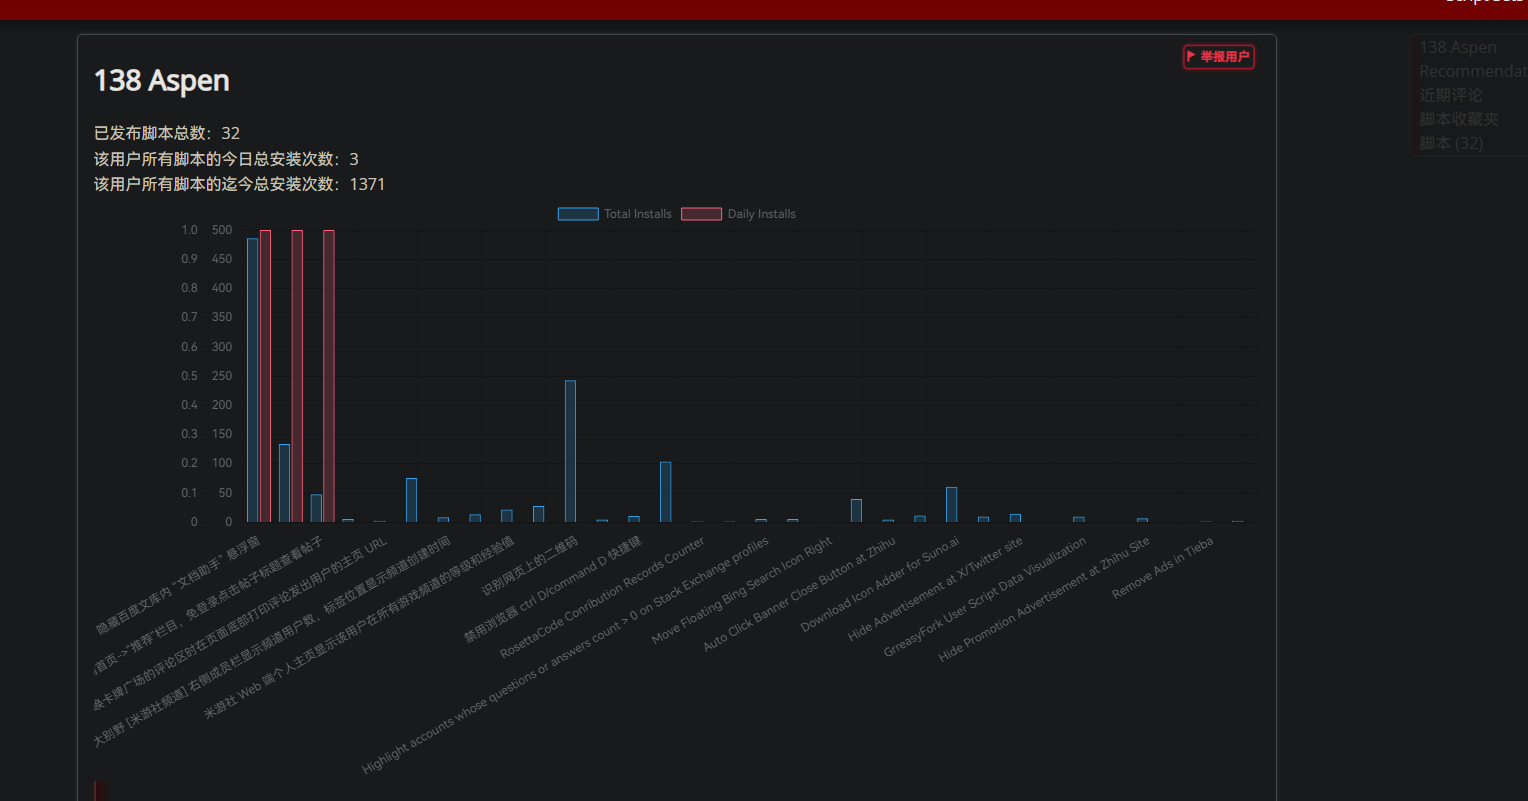
Increase: •Added original author138 AspenAdditional scriptDisplays the number of scripts published by the user, the total number of installationsGet user data from the current web page,You can set it in the script or in the script menuJSONData fetch or script data from the current page default toGreasyFrokDownload user data
Revise: •~~Revisechart.jsfor@require load,No need for repeated loading~~GreasyforkUnauthorized external scripts are not allowed
Revise: •Modify when obtaining user data from the network,Sort from high to low according to total installation volume
Revise: •Modify to find usersIDThe expression is/(\d+)/,compatibleGreasyfork Paste the rigging makerClear link useless character function

This userscript uses Chart.js Ku Cong GreasyFork Extract and visualize script data from user script pages on。It provides the following functions:
truehour,Get from current web page,forfalse,TowardsGreasyFrokDownload user dataJSON
If you encounter problems or need support,Please visit GitHub Question page Submit a question。
This script is modified from138 Aspenpublished scriptGrreasyFork User Script Data Visualization
Modification instructions:
Increase: •Added original author138 Aspenadditional scriptDisplays the number of scripts published by the user, the total number of installationsInside, get user data from the current web page,It can be set within the script or in the script menu.JSONData acquisition or script data acquisition from the current page
Revise: •ReviseGreasyforkUnapproved external scripts are not allowed.....chart.jsfor@require load,No need to reload every time
Revise: •When modifying user data obtained from the network,Sort by total installs from high to low
Revise: •Modify search for usersIDThe expression of/(\d+)/,compatibleGreasyfork Glue craftsmanClear link useless characters function
Contributions and improvements to the script are welcome!Please visit GitHub storehouse Submit a pull request or report an issue。
The script follows MIT license。For more information,Please check LICENSE document。
Fixed daily installation statistics on the right,Switch overall installation/Chart axis display problem during daily installation
| Before modification | After modification |
|---|---|
|
|
|
|
🔍You may be looking forGreasyForkRelated scripts
- Greasy forkScript pages are suitable for URL enhancement: Script details page is suitable for search without default URL redirection Turn to a clickable text link and pop up
- GreasyFork User-published script data visualization: useChart.jsObtaining and visualizing user script data,And generate a chart on the user’s personal homepage to display the detailed installation status below.
- GreaysFork EnhanceWebHookSync settings: GreaysFork Quickly enter script synchronization information,And add language codes for multiple countries in batches,Instead of clicking the selection boxes one by one and going to the corresponding URL。
- GreasyFork markdown: The default format used in the forum isMarkdown,Add format help link and publish new script,Reply time toolbar with quick editing enabled
- Greasyfork Script to display ratings: Add script rating after script name when browsing script list
- GreasyFork Search: Search using GoogleGreasyForkandSleazyForkupper script
- GreasyFork: Navigation bar enhancement: Add user list on navigation bar,console,Collection etc...
- Greasyfork Glue craftsman: for Greasyfork Provide various usage functions,absolute time,Web widescreen,Script page enhancements,Download extension,Panel repair and a series of operations
- GreasyFork Notification Assistant: When there’s a new reply to your script or to a discussion you’re participating in,The script will display the latest discussion content in a modal window on the web page。
- Script Finder GreasyFork Script Lookup: Script Finder Find on any website that applies to that website GreasyFork Script。
- Display the registration time of Greasyfork user and identify malicious comments: If your script interferes with the interests of some people, it is not surprising to receive malicious negative reviews. There are two characteristics of malicious negative reviews: one is that the account is usually newly registered, and the other is that the negative reviews will be given shortly after registration, and there will be basically no follow-up activities. This script gets the registration time of the greasyfork user and is displayed next to the user name. If the time displayed next to the user name is the future time, then the user is likely to be a malicious account registered.
Recommended browsers and script managers:
If you need to know more about how to install userscripts,click meView graphic teaching!
🔍You may be looking forChatGPTRelated scripts
- ChatGPTCode font size reduced: ChatGPT Make code font smaller and automatically wrap
- ChatGPT code highlighted: Add all language code highlighting for ChatGPT (using highlight.js)
- ChatGPT Chat copy code and export code buttons: exist chatgpt.com Add an animation in the lower right corner of the upper code block“Copy code”button and a for ChatGPT Code block in response adds export button,Prompts the user to save code to a file based on the programming language detected by the code block’s class name。
- ChatGPT Character counter limit (CCCL): Add a character counter to the input box,limited to 32732 characters。(ChatGPT The limit is 32732 characters。)
- ChatGPT Collapse self message and max width: foldChatGPTmedium and long“you”information,and set the maximum width
🔍You may be looking for web related scripts
- Web page writing clip version authorization manager: Manage the writing behavior of web pages to the clipboard to prevent unauthorized automatic copying and disable audio and video content preloading and automatic playback.
- LiftCSDNLoginCopy: fuck youCSDNLoginCopy,Copy without logging in
- Beautify web forms with gorgeous gradients: Automatically apply color gradients to all columns of the table to beautify it
- Highlight keywords on web pages: Highlight text on web pages,if it helps you,Can be modified and used at will
- Web page keyword highlighting: Custom keyword highlighting on web pages including dynamically loaded content on scroll
- Small window preview: Open link in popup window when dragging link,and provide a preview before opening,use Edge pre-reading technology。At the same time, add an acrylic effect behind the small window when it is opened.。
- Remove link underline: Remove link underlines on all sites,and handle new links dynamically
- scroll button: Generate two buttons on the right side of the page for scrolling the page
- Pin to top and bottom buttons: Generate two buttons on all pages,One for smoothing back to the top,One for continuous scrolling to the bottom,Click again to cancel scroll to bottom
🔍You may be looking forGitHubRelated scripts
- GitHub Submit information display web view: This script will GitHub The submission information on HTML view,to see submission details more clearly。It will automatically submit the information list、The commit header and latest commit information are converted to HTML Format,Provide better visual effects and user experience。
- Open jsDelivr link on Github: Open the GitHub link on jsDelivr to quickly download files
- GitHub warehouse quick jump assistant: 🤠 GitHub warehouse quick jump assistant, specially designed to help users quickly access their own warehouses on GitHub. It generates a button at the top of the navigation bar. Click to expand all your repositories and easily jump to your own GitHub repository page without using GitHub’s secondary menu.
- GitHub File list beautifier: GitHub File List Beautifier is a user script,used to enhance GitHub Display effect of files in warehouse。It can add colors to files and folders,and replace the file type icons with small images,Makes the code base easier to browse and manage。Add colors and icons to files by type,Display small images in place of file type icons in repository source tree
- Github List of code languages show all: Expand Github List of languages on the repository,Show each language,Instead of hiding small parts in“other”Down
- GitHub Automatically confirm device authorization: existGitHubThe authorization page automatically enters the authorization code and automatically confirms it.。
- GitHub folder downloader: Add a download button,Allows easy downloading of specific GitHub folder。
- Github Copy original file URL with download files: Add button at the end of each file line,to copy the original file URL and download files
- 🤠 Github enhanced assistant warehouse display size: 🤠 Warehouse display size: On GitHub’s code search, warehouse search, issue page, user warehouse list and repository page, the size of the warehouse will be displayed next to the warehouse name, allowing users to quickly understand the scale of the warehouse and optimize their selection. Inactive development warning: If a repository has not been updated in the past six months, the system will add a prompt at the top of the repository to remind users that the repository is inactive and display the time of the last update. This helps users determine the activity and maintenance status of the warehouse. Quick jump within the warehouse: When browsing the warehouse, the user can easily view the list of all warehouses of the user, providing an entrance to quickly jump to different warehouses. Users can quickly find and access other projects of interest, improving work efficiency. Usage scenarios: Developers: By displaying the warehouse size and active warnings, you can quickly filter out suitable libraries for development and avoid using projects that are no longer maintained. Project Manager: Through the quick jump function, it is easy to manage and coordinate multiple projects and improve work efficiency. Learners: When learning new technologies, they can more easily find relevant open source projects and quickly check the activity and scale of the projects. 🤠
- GitHub Sort by date: Change file sorting to descending by date,Conveniently view the latest updated files。
- GitHub Gist code snippet copy and downloader: Add a copy button to the Gist file to make the code easily copied. | Add a download button to the Gist file to easily download the code.
🔍you may be looking forGoogleRelated scripts
- Google Advanced search assistant: Add an advanced search form to the top of your Google search page
- Block Google search site: existgoogleSearch and block specific sites
🔍You may be looking forGreasyForkRelated scripts
- Greasy forkScript pages are suitable for URL enhancement: Script details page is suitable for search without default URL redirection Turn to a clickable text link and pop up
- GreasyFork User-published script data visualization: useChart.jsObtaining and visualizing user script data,And generate a chart on the user’s personal homepage to display the detailed installation status below.
- GreaysFork EnhanceWebHookSync settings: GreaysFork Quickly enter script synchronization information,And add language codes for multiple countries in batches,Instead of clicking the selection boxes one by one and going to the corresponding URL。
- GreasyFork markdown: The default format used in the forum isMarkdown,Add format help link and publish new script,Reply time toolbar with quick editing enabled
- Greasyfork Script to display ratings: Add script rating after script name when browsing script list
- GreasyFork Search: Search using GoogleGreasyForkandSleazyForkupper script
- GreasyFork: Navigation bar enhancement: Add user list on navigation bar,console,Collection etc...
- Greasyfork Glue craftsman: for Greasyfork Provide various usage functions,absolute time,Web widescreen,Script page enhancements,Download extension,Panel repair and a series of operations
- GreasyFork Notification Assistant: When there’s a new reply to your script or to a discussion you’re participating in,The script will display the latest discussion content in a modal window on the web page。
- Script Finder GreasyFork Script Lookup: Script Finder Find on any website that applies to that website GreasyFork Script。
- Display the registration time of Greasyfork user and identify malicious comments: If your script interferes with the interests of some people, it is not surprising to receive malicious negative reviews. There are two characteristics of malicious negative reviews: one is that the account is usually newly registered, and the other is that the negative reviews will be given shortly after registration, and there will be basically no follow-up activities. This script gets the registration time of the greasyfork user and is displayed next to the user name. If the time displayed next to the user name is the future time, then the user is likely to be a malicious account registered.
🔍You might be looking for adult scripts
- MissAV Automatic login: Detection MissAV state,and automatically log in when not logged in
- xhamster video one-click download assistant: xhamster video download with one click | xhamster.com | Download directly without login | All viewable resolutions can be downloaded
- XnxxVideos Video One-click Download Assistant: XnxxVideos Video download with one click | xnxx.com | Download directly without login | All viewable resolutions can be downloaded
- xvideos push download: 1. Automatic playback 2. Automatic widescreen 3. High-quality playback 4. Click to push the next movie 5. Download thumbnails
- Pornhub video download with one click: Pornhub video download with one click | pornhub.com | Download directly without login | Download free to watch paid videos | Download videos that are prohibited | Download all viewable resolutions
- MissAV video download tool: Sniff the real download address of the video from the current missav playback page and download it
- MissAvBatch backup collection of videos: From the currentmissavPage to obtain picture files and video information,After the merge result is combined, provide the downloaded web page file
- ThisAV Automatic login: Detection ThisAV state,and automatically log in when not logged in
- JableTV Automatic login: Detection JableTV state,and automatically log in when not logged in
- MissAV Enhanced Assistant: Remove ads | Backstage play | Autoplay | Custom fast forward time | Full title | More features...
🔍You may be looking for automatic translation
- foreign language terminator: Recognize non-Chinese characters,If the length is greater than5And the translated text does not contain Chinese,Then translate and replace the original text to Chinese
- web page translation——Automatically translated to Chinese: Give the lower right corner of each non-Chinese web page(Can be adjusted to the lower left corner)add agoogleTranslate icon,This version is a Chinese translation version,Only translate foreign languages into Chinese,Add automatic translation
🔍You might be looking for social media scripts
- Twitter/X Hide retweeted posts: Automatically hide forwarded content and hide forwarded content on first loading to remove annoying ads
- Twitter Media Download: Download videos/pictures with one click | and automatically package them as a ZIP file to download during batch download
